

Ask what return a life insurance investment delivers and you will rarely get a number. You will get a projected maturity value, a bonus history or a comparison against a bank deposit. None of those is a return. This article shows how to compute the actual yield on a policy before you commit, and how that figure tends to compare with the alternatives available to Indian investors.
Key Takeaways
- A maturity value is not a return. The only comparable measure is the internal rate of return across every premium you pay and every rupee you receive.
- Illustrated figures use prescribed gross assumption rates for comparison. Your net yield after allocation, administration and mortality charges will be lower, and the gap is widest in the early years.
Why a Maturity Value Tells You Nothing on Its Own
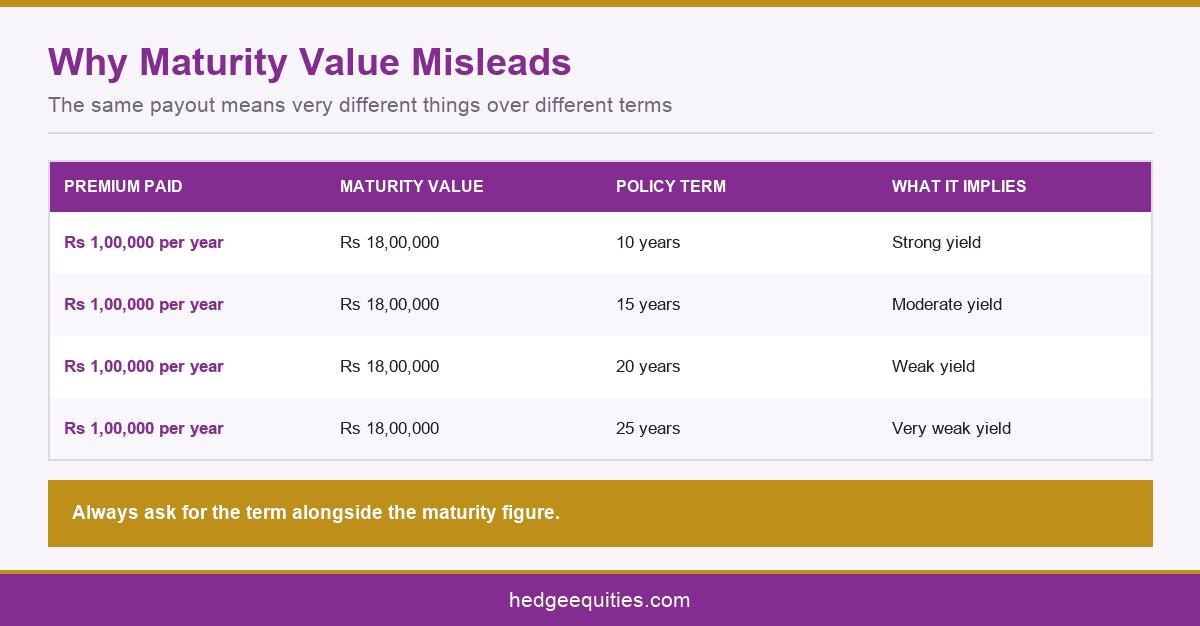
A policy promising eighteen lakh rupees on a one lakh annual premium sounds generous until you notice the term. Spread across twenty years, the same figures describe a very ordinary outcome. Time is the missing variable in almost every sales conversation.
The comparison most investors make is total premiums paid against total amount received. That framing ignores when each rupee moved. A premium paid in year one has twenty years to work. A premium paid in year nineteen has one. Adding them together as though they are equivalent systematically flatters the product.
The correct measure is the internal rate of return, which accounts for the timing of every cash flow. Any spreadsheet computes it with a single function. Enter each premium as a negative figure in the year it is paid, the maturity value as a positive in the final year, and read the result. That percentage is the honest answer to what your life insurance investment returned.
A second distortion is worth naming. Sales conversations often compare total premiums paid against total received and describe the difference as profit. Over a twenty year term, general inflation alone will have reduced the purchasing power of that difference substantially. A nominal gain is not the same as a real one, and only the internal rate of return makes the distinction visible.
How to Read the Two Illustrated Rates
Every illustration shows projections at two prescribed gross investment return assumptions. These exist so that products can be compared on a common basis. They are not forecasts, and the higher of the two is not a target you should plan around.
The prescribed rates apply to the gross investment return of the underlying fund, before the charges specific to your policy are deducted. What reaches you is lower, sometimes considerably so. This is not concealment, since the charges are disclosed, but they appear in different sections and different units, which makes the total difficult to feel.
Ask the distributor for one figure: the total rupee value of all charges across the full policy term. If that number is not readily available, compute the internal rate of return from the illustration itself, which captures the same effect. TheInsurance Regulatory and Development Authority of India prescribes the illustration format precisely so that this comparison is possible.
It is also worth separating the guaranteed element from the projected one. Where an illustration blends a contractual guarantee with discretionary bonuses, compute the internal rate of return twice: once on the guaranteed cash flows alone, and once on the full projected figure. The first is what you are actually promised. The gap between the two tells you how much of the appeal rests on something nobody has committed to.
Comparing Against the Realistic Alternatives
Once you have a net yield, the question becomes what else that money could have done over the same period at a comparable risk level. This is where the decision is actually made, and where most conversations stop too early.
A participating traditional plan is closer to a conservative debt instrument than to an equity investment, because the with profits fund it draws from is heavily weighted toward fixed income. The fair comparison is therefore against government securities, high qualitybonds or a conservative debt fund, not against a savings account.
Over horizons of fifteen years or more, diversified equity has historically delivered materially more than conservative debt in India, though with volatility along the way. If your policy is meant to fund a goal two decades out, that comparison belongs in the decision. Our guide to choosing between a unit linked plan and term cover plus a systematic investment plan works through a full twenty year illustration.
Risk should be held constant in any comparison. Comparing a guaranteed policy against equity and concluding that equity wins ignores the fact that the two carry very different risk. The fair test is whether the policy's net yield beats a debt instrument of similar safety and similar term. If it does not, the shortfall is the price you are paying for the life cover bundled inside it, and that price should then be compared against a standalone term premium.
Use published data rather than a distributor's summary when you make that comparison. Historical category returns for every mutual fund category in India are published byAMFI, and government security yields are available from theReserve Bank of India. Both give you an independent benchmark against which any illustrated policy value can be judged.

The Cost of Leaving Early
Return calculations assume you hold to maturity. A meaningful share of policyholders do not, and the yield on an early exit is a different and much harsher number that rarely appears in any sales conversation.
Traditional policies typically acquire a guaranteed surrender value only after a minimum number of premiums have been paid, and even then at a fraction of premiums paid. Exit before that point and the return is deeply negative. The surrender value table, usually printed near the back of the illustration, is the honest disclosure here.
Before committing, ask yourself what the realistic probability is that you will need this money within ten years. If it is not close to zero, that risk should drive the product choice more than the projected maturity figure. Afinancial health checkup that maps your liabilities and emergency reserves is the practical way to answer that question.
Paid up status is the middle option many investors overlook. Rather than surrendering, you can sometimes stop paying premiums and let the policy continue with a reduced sum assured. That avoids crystallising a surrender loss while releasing your future premiums for other use. Whether it beats surrendering depends on the reduced benefit and how many premiums you have already paid.
What This Means for Insurance Investors
None of this makes life insurance a poor product. It makes it a protection product that also happens to accumulate value. Judging it by the standard appropriate to its actual function produces much better decisions.
If your objective is protection, the relevant test is cost per rupee of cover, and pure term insurance wins that test decisively. If your objective is growth, the relevant test is net yield against comparable alternatives, and dedicated investment vehicles usually win that one. Problems arise when a product bought for one purpose is judged by the other.
Work out which objective you are actually buying, compute the number that matches it, and compare like with like. Our broader guide toinsurance and investment in India sets out the full framework, and our team in Kochi is happy to run the calculation on a policy you are considering.
A final point on framing. If the policy was bought primarily for protection, its accumulation is a secondary feature and judging it on yield is unfair. If it was bought primarily to accumulate, the cover is the secondary feature and the yield is the correct test. Difficulty usually arises when a product sold for one reason is later defended on the other, and the honest response is to decide which purpose it actually serves for you.
Conclusion
A life insurance investment should be assessed on its internal rate of return, computed from your own premium schedule, net of all charges, and compared against alternatives of similar risk. That takes a few minutes in a spreadsheet and routinely changes the decision. If you would like an existing policy assessed on that basis before you renew or surrender it,speak to Hedge Equities.
Frequently Asked Questions
What return does life insurance give in India?
It varies widely by product and term. Participating traditional plans typically deliver yields closer to conservative debt than to equity. Compute the internal rate of return from your own premium schedule rather than relying on the maturity figure.
How do I calculate the return on my policy?
Enter each premium as a negative cash flow in the year paid, the maturity value as a positive in the final year, and apply the internal rate of return function in any spreadsheet. The result is your actual yield.
Are illustrated returns guaranteed?
No. Illustrations use prescribed gross assumption rates so products can be compared on a common basis. They are not forecasts, and the net amount you receive is lower once policy charges are deducted.
Is life insurance better than a fixed deposit?
They serve different purposes. A deposit is liquid and short term. A policy is illiquid and long term but carries life cover. Compare net yields over the same horizon and weigh the liquidity difference.
What happens if I stop paying premiums?
The policy may lapse or convert to a paid up value with reduced benefits, depending on how many premiums you have paid. Early lapse usually returns well below premiums paid.
Do bonuses increase my return?
Declared bonuses do add to the maturity value, but they are declared at the insurer's discretion from a with profits fund and are not guaranteed in advance. Past bonus rates do not commit future ones.
Is the maturity amount taxable?
It can be. For policies other than unit linked plans issued from 1 April 2023, the exemption is lost where aggregate annual premium exceeds five lakh rupees. Check your issue date and total premium.
Should I surrender a poorly performing policy?
Not automatically. Compare the surrender value plus the return on redeploying it against continuing to maturity. Sometimes continuing wins because early charges are already paid. Model both before deciding.
What is a good yield to expect from investment insurance?
Rather than a target figure, compare your computed yield against a comparable debt instrument over the same period. If it falls materially short, the protection element should justify the difference.
Where can I get an existing policy reviewed?
A SEBI registered advisory firm can compute the yield and compare alternatives. Hedge Equities offers this as part of a review ofour products and services for investors across Kerala.