
Search for best investment portfolio management and most results rank providers by headline returns or hand out a top ten badge with no visible methodology. Our own guide to choosing a PMS provider covers the practical selection checklist. This article deliberately avoids repeating that listicle format and instead teaches the two calculations that actually separate a genuinely strong manager from one that simply had a favourable year: fee-adjusted return and risk-adjusted return, and how to find both in the disclosures every SEBI-registered portfolio manager is required to provide. Neither calculation is complicated once you know where to look, and both are far more predictive of what an investor actually experiences than any ranking based purely on a single year's headline number.
Key Takeaways
A headline return figure without fees subtracted overstates what an investor actually keeps.
Risk-adjusted measures like the Sharpe ratio reveal whether a return was earned efficiently or through excess volatility.
The disclosure document and TWRR statement, not marketing material, are where these numbers should be verified.
Why the Headline Return Is the Wrong Starting Point
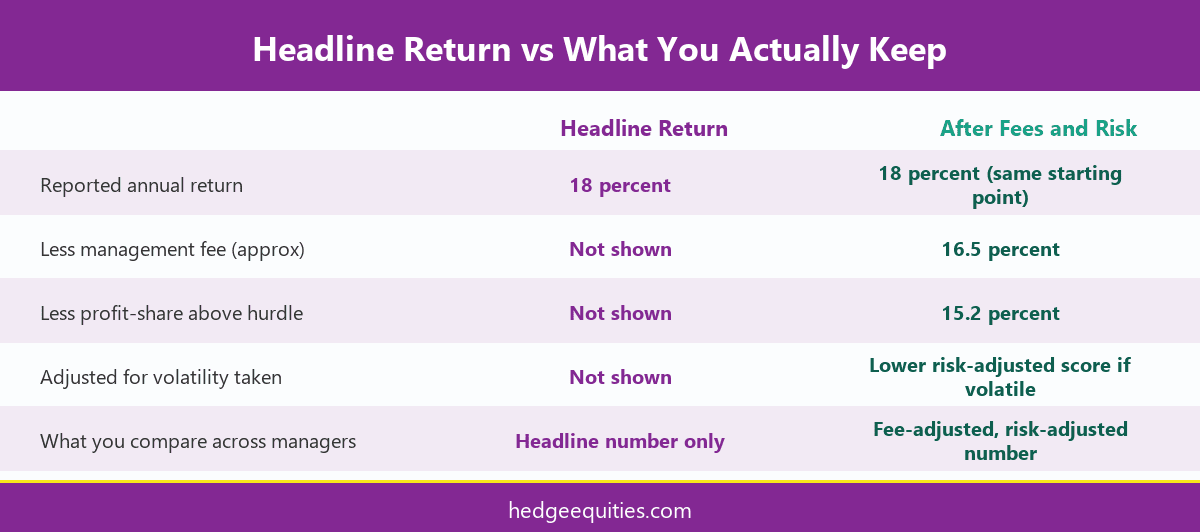
A portfolio manager advertising an eighteen percent annual return sounds better than one advertising fifteen percent, until fees enter the picture. A typical PMS fee structure combines a fixed management fee, often around two percent, with a profit-share component above an agreed hurdle rate, commonly ten to fifteen percent of gains beyond that hurdle. Once both are subtracted, the eighteen percent manager might deliver an investor return closer to fifteen and a half percent, while the fifteen percent manager on a lower fee structure might deliver close to fourteen, a far smaller gap than the headline numbers suggested. Comparing managers on the pre-fee figure alone is comparing two different products as though they were the same one, and it is the single most common mistake investors make when shortlisting providers. This mistake is compounded when a manager advertises returns from only their best-performing client accounts or a single strong calendar year, rather than an asset-weighted composite across the full client base over multiple years. SEBI's disclosure norms exist partly to close this gap by requiring standardised, composite-level reporting, but an investor still has to know to ask for it specifically, since a marketing brochure will naturally lead with the most flattering number available rather than the most representative one. A useful habit is to ask specifically for the composite return across all discretionary client accounts under a given strategy, rather than a single account's result, since the composite is far harder to selectively flatter and gives a truer sense of what a new client joining today could realistically expect from that same strategy going forward.
[Alt: Comparison of headline return versus fee-adjusted, risk-adjusted return] | File: infographic-1-fee-adjusted-vs-headline-return.png
Computing a Rough Post-Fee, Post-Tax Number Yourself
You do not need a finance degree to run a reasonable estimate. Start with the disclosed gross return for the period you are comparing. Subtract the fixed management fee percentage directly. For the profit-share component, subtract the agreed share of any return above the hurdle rate specified in the disclosure document, applied only to the portion above that hurdle, not the whole return. The result is a rough post-fee number you can genuinely compare across providers on equal footing. If a manager is unwilling to state the hurdle rate and profit-share percentage in plain terms, that reluctance is itself useful information about how the relationship is likely to be managed going forward. It is also worth running this calculation across more than one time period. A fee structure can look reasonable applied to a single strong year and considerably less reasonable applied to a longer stretch that includes a flat or negative year, since fixed management fees continue to apply regardless of performance while profit-share fees do not. Asking for a five-year, post-fee comparison rather than a single-year snapshot gives a far more honest picture of what the fee structure actually costs across a realistic market cycle. Keep a written note of the exact figures used in this calculation and the date they were disclosed, since fee structures can be revised at renewal, and having the original terms on record makes it far easier to spot a change that was not clearly flagged at the time it happened.
Risk-Adjusted Return: Why a Higher Number Isn't Automatically Better
Two managers can post identical post-fee returns while taking very different amounts of risk to get there. The Sharpe ratio, a widely used risk-adjusted measure, divides the return earned above a risk-free rate by the volatility of that return, giving a sense of how much risk was taken per unit of reward. A manager who reaches fifteen percent through concentrated, highly volatile bets has effectively borrowed against future stability to produce today's number, and the same approach can just as easily produce a sharp loss in a different market cycle. A manager who reaches the same fifteen percent with meaningfully lower volatility has, in a genuine sense, done a better job, even though the headline figure looks identical on paper. Volatility is not simply an academic concern either. A highly volatile path to the same destination return means the investor experiences much larger swings in reported portfolio value along the way, which is precisely the condition most likely to trigger the panic-selling and mistimed exits that erode real-world returns regardless of what the manager eventually delivers on paper. A calmer, lower-volatility path to a comparable return is often easier for an investor to actually stay invested through, which matters as much as the number itself. When comparing risk-adjusted figures across providers, also check that the comparison uses the same benchmark index and the same time window, since a manager can appear to have a stronger risk-adjusted profile simply by choosing a less demanding benchmark or a shorter, more favourable measurement period, rather than through any genuine difference in how the portfolio is actually managed.
Reading the TWRR Disclosure Correctly
SEBI requires PMS providers to report performance using Time-Weighted Rate of Return, TWRR, specifically because it strips out the effect of when money was added to or withdrawn from the account, which a simple absolute return figure does not. When comparing managers, confirm you are looking at TWRR figures over the same time period and the same market conditions, since a manager who started three years ago during a strong bull run will show different numbers than one who started during a correction, independent of actual manager skill. Ask specifically for the TWRR over rolling three and five year periods rather than a single favourable window, since a single strong year can flatter an otherwise unremarkable longer-term record. It is equally worth checking whether the TWRR figures shown are gross or net of fees, since a manager can technically comply with the disclosure requirement while presenting the gross figure prominently and the net figure only deeper in the document. Reading the actual disclosure document, rather than a one-page performance summary, is the only reliable way to confirm which figure you are actually looking at before comparing it against another provider.
Putting It Together: A Short Comparison Checklist
Before treating any provider as best for your situation, work through four questions using their actual disclosure documents rather than marketing brochures. What is the post-fee, post-tax return over rolling three and five year TWRR periods? What is the approximate risk-adjusted return relative to a comparable benchmark index? How concentrated is the portfolio, since concentration is a direct driver of the volatility behind that Sharpe-style calculation? And finally, does the manager explain these numbers clearly when asked directly, or only in response to persistent follow-up questions. A provider who welcomes this level of scrutiny is signalling exactly the kind of transparency you should expect to continue after you have signed the mandate, not just during the sales conversation. None of these four questions require specialised financial training to ask, only the discipline to ask them before signing rather than after, when the leverage to negotiate fee terms or walk away entirely is considerably stronger than it will be once capital has already been committed. Writing the answers down at the time of onboarding also creates a useful reference point: a year or two later, you can revisit the same four questions and check whether the manager's actual behaviour has matched what was promised at the outset, which is a far more concrete test of the relationship than simply watching the portfolio value on a screen.
Conclusion
Best investment portfolio management is not the provider with the highest number on a marketing slide. It is the provider whose post-fee, post-tax, risk-adjusted return over a full market cycle genuinely serves your specific goals, verified against their own disclosure documents rather than taken on faith. Run the two calculations in this article on any shortlist before deciding, and pair the result with the practical checklist in our PMS selection guide. Hedge Equities is glad to walk through our own fee-adjusted numbers using exactly this method, and to show how our own disclosure document presents fees, hurdle rates, and TWRR so you can apply the same checklist here to our numbers as readily as to anyone else's. A number worth trusting is one that survives being checked this closely, and we would rather you checked it than took it on faith.
Frequently Asked Questions
What does fee-adjusted return mean in portfolio management?
It is the return an investor actually receives after subtracting the fixed management fee and any profit-share charged above an agreed hurdle rate.
Why is a risk-adjusted return more useful than a headline return?
Because two managers can post the same headline number while taking very different levels of risk, and a risk-adjusted measure like the Sharpe ratio reveals that difference.
What is TWRR and why does SEBI require it for PMS reporting?
Time-Weighted Rate of Return removes the distortion caused by when money was deposited or withdrawn, giving a fair measure of the manager's actual investment skill.
How do I calculate a rough post-fee return myself?
Subtract the fixed fee percentage from the gross return, then subtract the agreed profit-share percentage applied only to gains above the disclosed hurdle rate.
Is a higher Sharpe ratio always better?
Generally yes, since it indicates more return earned per unit of risk taken, but it should be compared across managers using the same time period and benchmark.
Where can I find a PMS provider's actual fee structure?
It must be disclosed in the mandatory Disclosure Document every SEBI-registered portfolio manager provides, which should be requested and read before signing any mandate.
Does a top ten PMS listicle reflect actual investor outcomes?
Not reliably. Most listicles rank on headline, pre-fee returns over a single period, which can favour a volatile or recently fortunate manager over a consistently disciplined one.
How often should I review a PMS provider's fee-adjusted performance?
At least annually, using rolling three and five year TWRR figures rather than the most recent single year alone, to avoid being misled by short-term outperformance.
What is a hurdle rate in a PMS fee structure?
It is the minimum return threshold that must be crossed before the portfolio manager earns a profit-share fee, protecting the investor from paying performance fees on mediocre results.
Should I choose a PMS provider based only on past returns?
No. Past returns should be read alongside fees, risk taken, and process discipline, covered in our related read on what happens inside a PMS investment process.